Example Application: Physical Segmentation of an Image of Sediment Grains
An image, or any rasterized data set, can be treated as structured geospatial data and is amenable to processing with PySESA. Here the potential utility of being able to map spectral parameters continuously in space for the purposes of automated segmentation of natural scenes is illustrated. This could find particular utility in segmentation of natural textures in remote sensing imagery using physical lengthscales.
An image of mixed sand, gravel and cobble (Figure below), collected on a beach fronting the Strait of Juan de Fuca, on the Elwha River delta in Washington State, USA, was analysed using PySESA::spectral. The field site and data collection is described in Warrick et al. (2009, Earth Surface Processes and Landforms). The scene is composed of 0.491 mm pixels over a 417 x 343 mm area. The grain sizes range from about 1 to 50 mm - most of the image area comprised of grains in the region 1-10 mm with isolated pebbles 20 to 50 mm in diameter. The image was converted into a point cloud by assigning each 8-bit intensity value to the pixel coordinate, within a local coordinate system defined in mm starting from the lower left corner of the image. The output grid spacing was 9.82 mm (20 pixels) composed of windows with 50% overlap. The detrending option was a simple mean-subtraction. The spectral RMS roughness (b), spectral strength (c) and integral lengthscale (d) performed particularly well at delineating regions of sand, gravel and isolated pebbles. Of these, the integral lengthscale is most closely associated with a grid-by-number style measure of intermediate (b-axis) grain size. Figure d shows the portion of the image where grains are less than and greater than 5mm (about the boundary of fine to coarse gravel on the Wentworth sediment classification scale) which closely correspond to the grain sizes of the images in those regions. This approach could be a physically-based means by which to simultaneously measure grain size and delineate the areal coverages of patches of sediment types.
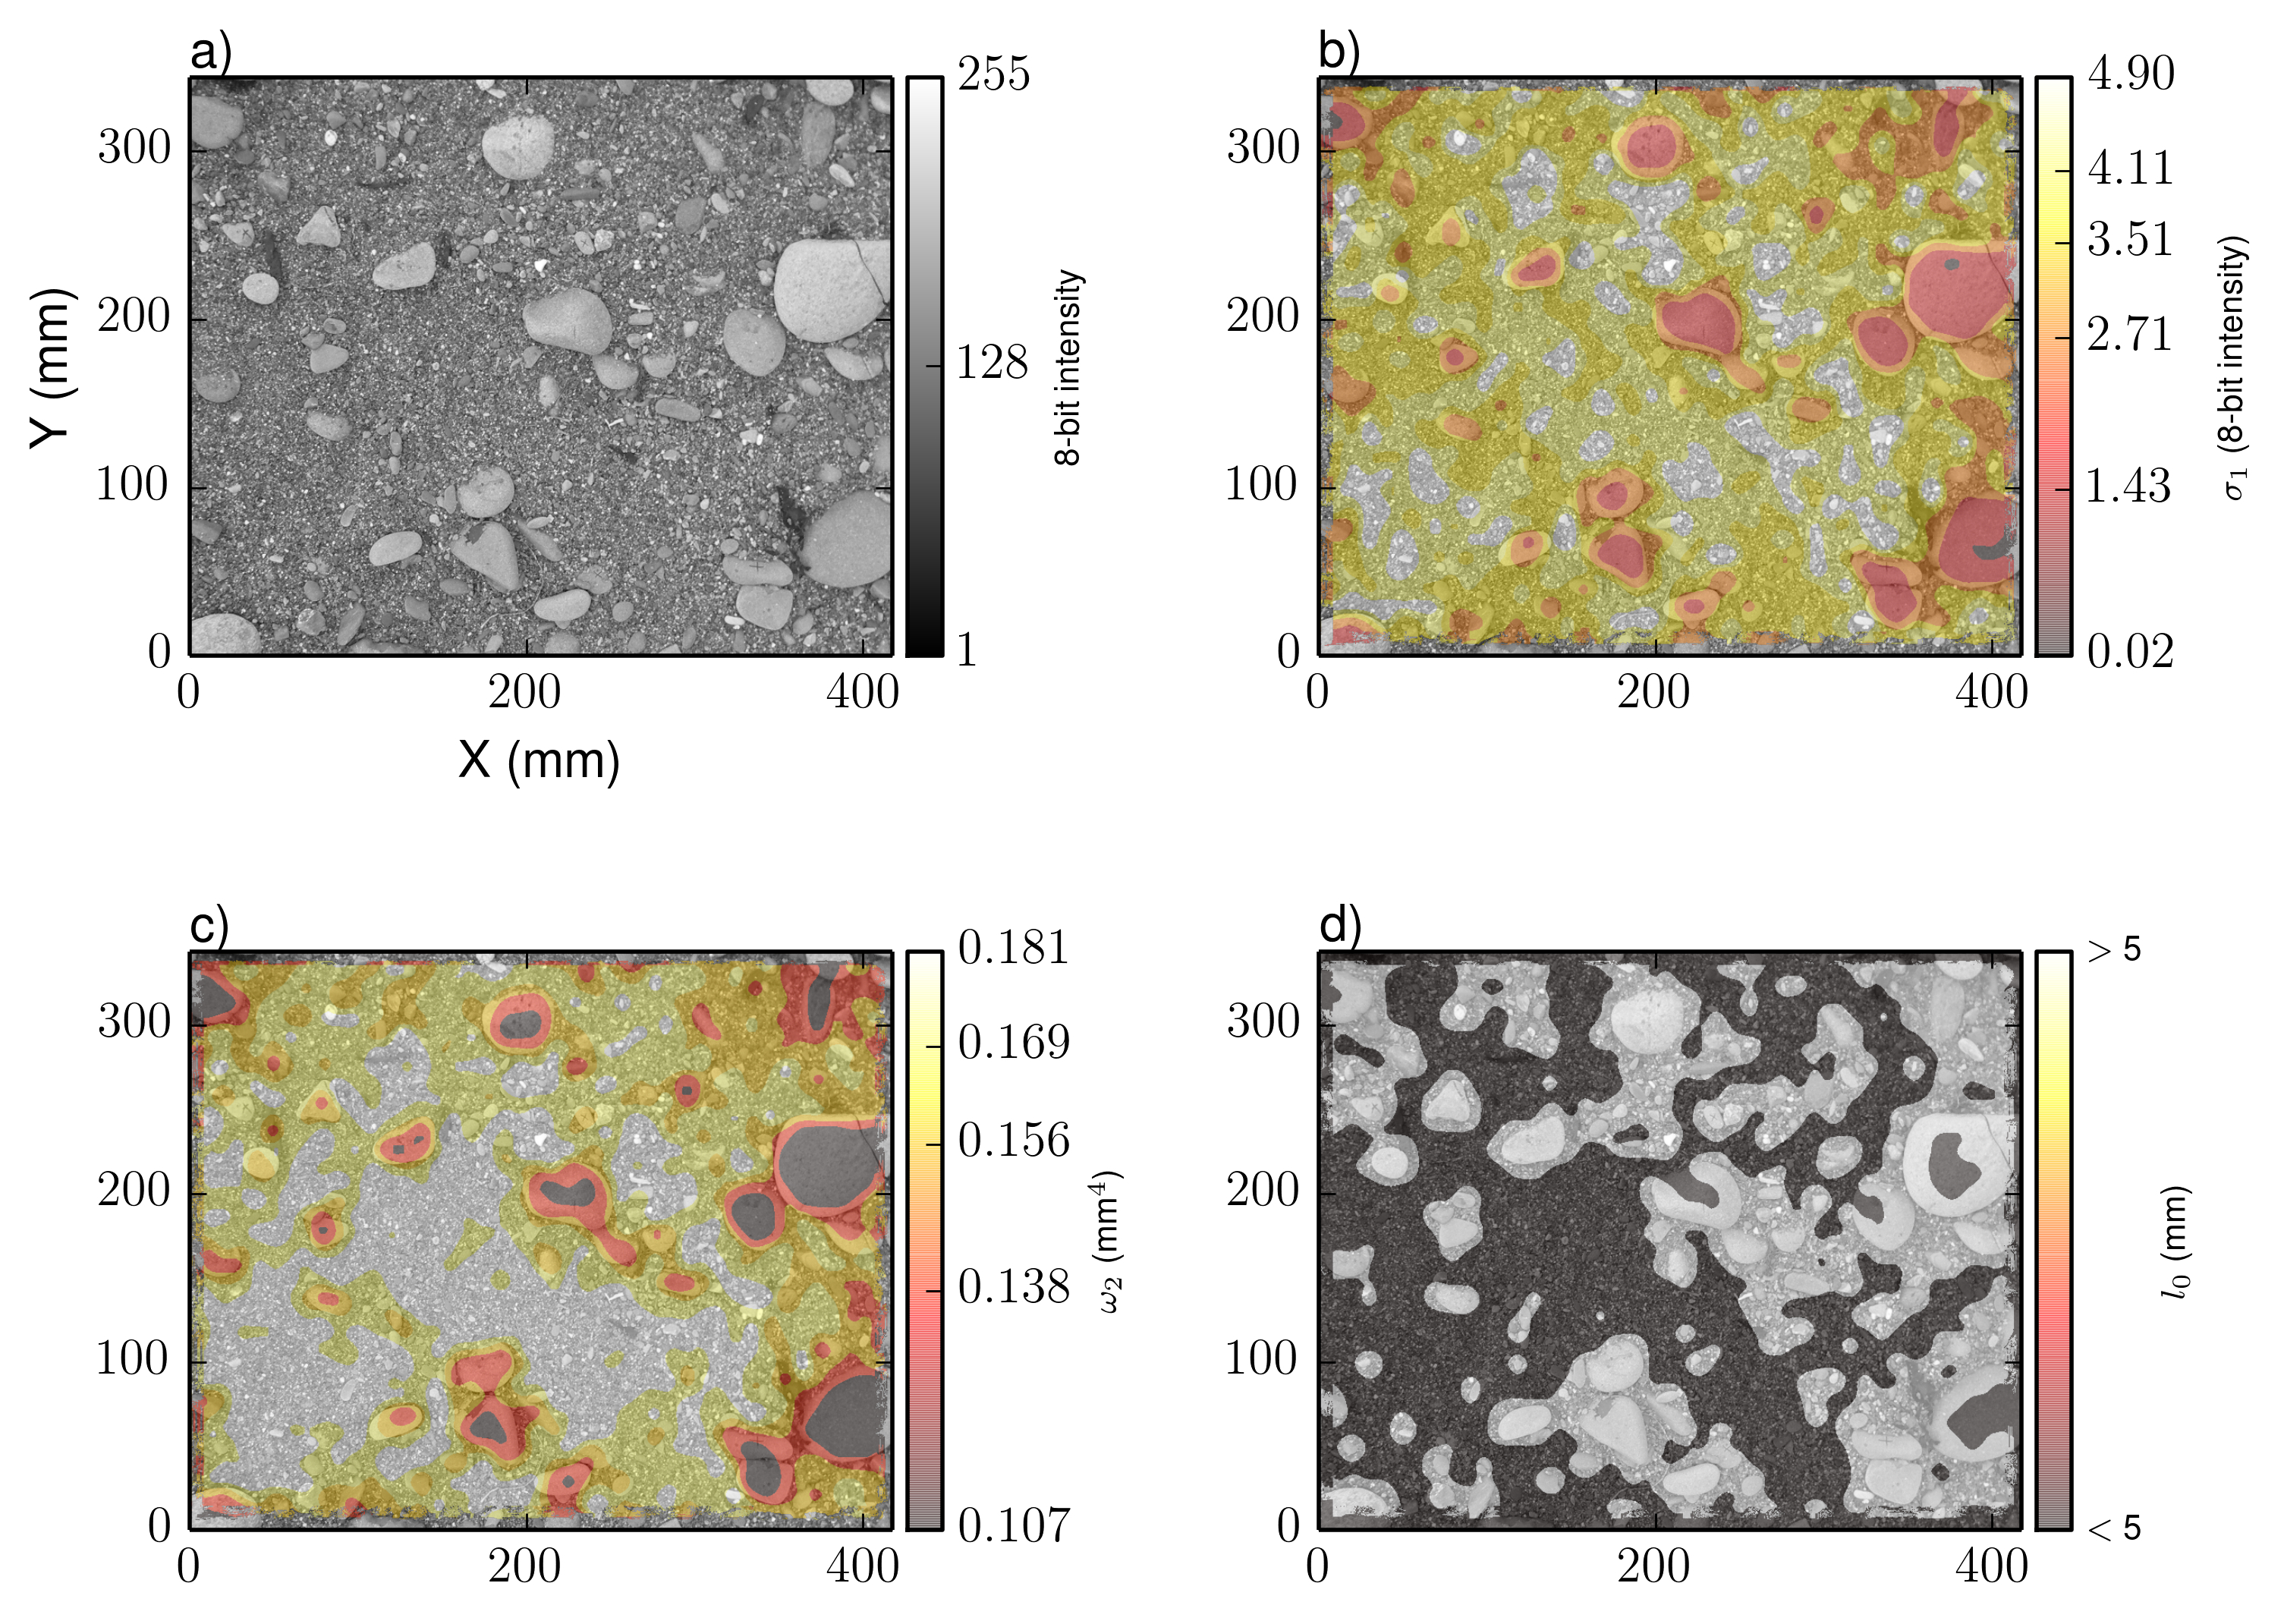
a) 8-bit greyscale intensity image of coarse sand, gravel and pebbles; b) greyscale image overlain by contour map of spectral RMS amplitude, sigma_1; c) greyscale image overlain by contour map of spectral strength, omega_2; and d) greyscale image overlain by binary map of where integral lengthscale, l_0 is <5 (dark) and >5 (light) mm.